
Product + service design · Mar–Apr 2025
Nollution
StatusBuoy concept + app prototype · shaped by critique, not field-tested
Hear the unheard.

- Problem
- Ship noise threatens the Gulf’s last 50 or so Rice’s whales, and people on that coast can’t see the noise or help measure it.
- What I did
- Solo, I mapped marine science and citizen-science research, built 6+ physical buoy models, and designed a buoy plus a 4-screen app that turns readings into plain sentences.
- Result
- Critique reshaped the concept: partners now handle deployment, and a drift alert answers “what if it drifts to the Atlantic?” Not yet tested with coastal residents.
- 3
- evidence sources
- 6+
- physical buoy versions
- 3
- critique questions answered
- 4
- core app screens
Problem
The noise is documented. It’s just invisible.
About 50 Rice’s whales remain in the Gulf of Mexico. NOAA lists noise from vessels and energy exploration as a major threat to their survival.
- 0.07
- whales a year: the most the population can lose and stay viable
- 0.5
- whales a year: known deaths and serious injuries from human causes
Fewer than one death every 10 years is sustainable; human causes already account for one every two. Source: NMFS stock assessment (2022), via Congressional Research Service, The Rice’s Whale (2026).

Coastal residents
Understand the water near home.
Citizen-science volunteers
Contribute to ocean-noise research.
Recreational boaters
Collect observations on the water.
The gap: a way to help that’s visible, needs no boat or science degree, and fits daily life. Source: NOAA Fisheries, Rice’s Whale Passive Acoustic Detections Report (2025).
Research
Evidence that shaped the concept.
I used published research to understand noise and participation, and design critique to explore deployment. Each card connects the evidence to a design response.
Published research · NOAA
Vessel noise can mask whale calls.
NOAA describes how low-frequency ship noise overlaps whale calls and can make it harder for whales to hear each other. This supports monitoring noise; it does not establish what coastal residents need from an app. Source: NOAA Fisheries ↗
Led toShow noise trends with plain-language labelsSee the decision ↓Project evidence · Design critique
Deployment raised practical questions.
My reviews raised questions about deployment, access without a boat, and drift. These are qualitative design critiques, not findings from a user study.
Led toInclude partner-supported deployment and recoverySee the decision ↓Published research · Participation
10% → 79% of contributors → average share of contributions
A small group contributed most of the work.
Across 7 online citizen-science projects, the top 10% supplied an average 79% of classifications. This suggests a participation risk to investigate; it does not predict engagement with Nollution. Source: Sauermann & Franzoni, 2015 ↗
Not yetExplore following one local buoy; test whether people return
From sketch to buoy


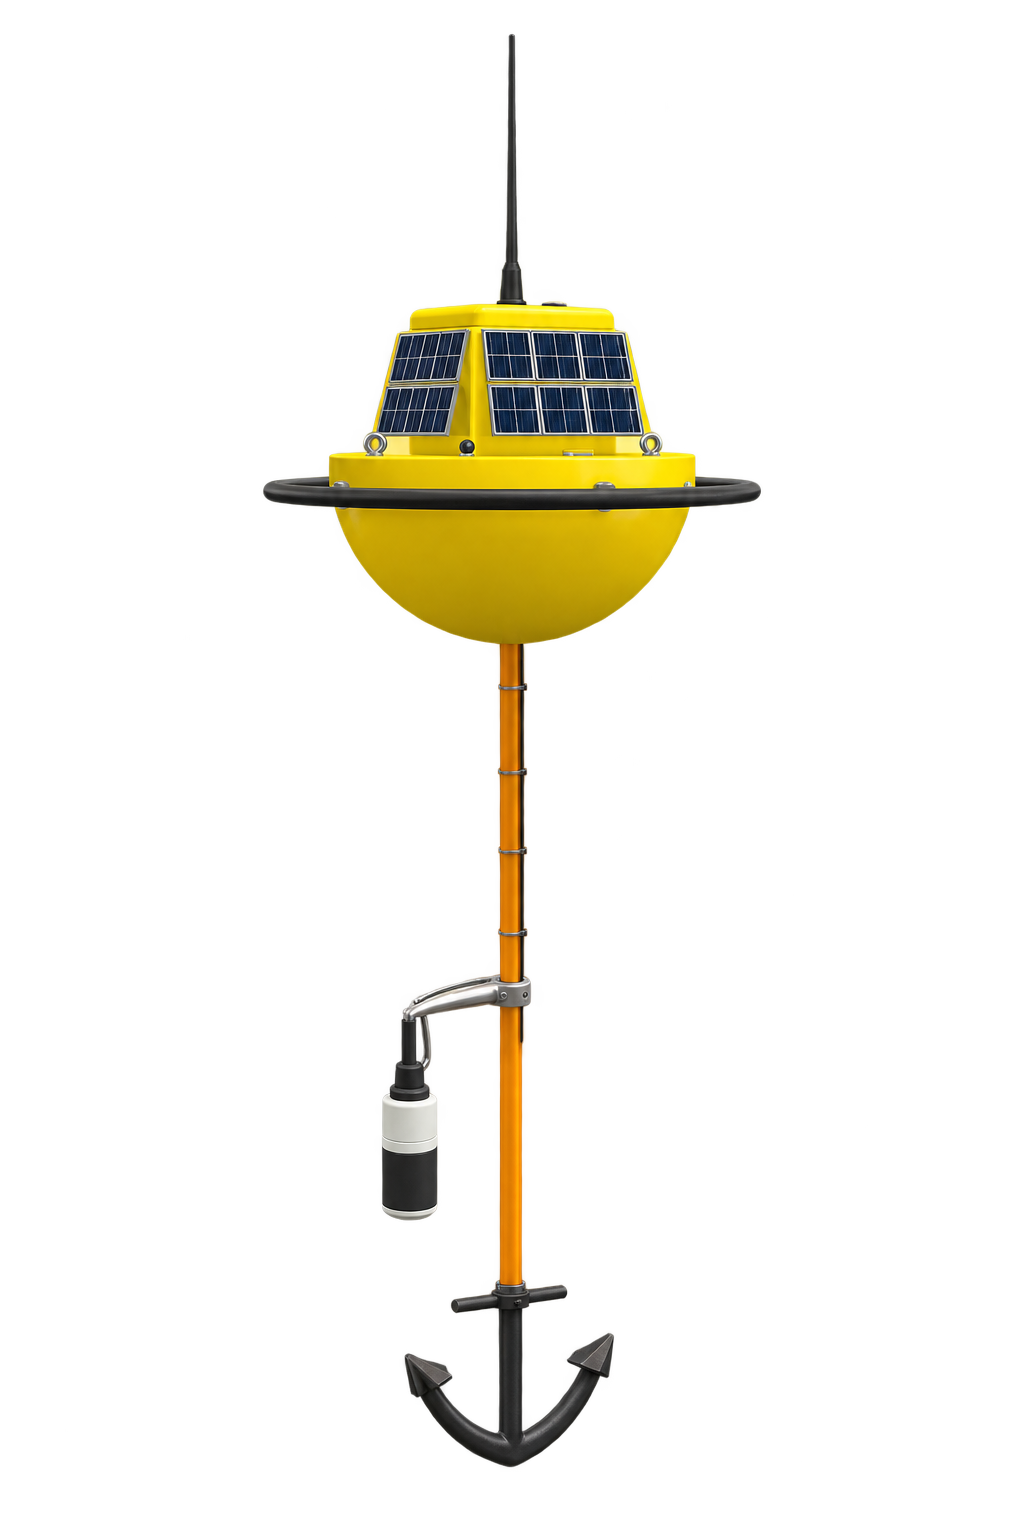
Six physical versions came before the Blender model. Each was tested for buoyancy and for whether a non-engineer could tell which way was up. The app moved in parallel through paper sketches, Figma, and a clickable prototype.
What critique changed
Participation without doing everything alone.
- Evidence
- Design critique questioned deployment, access without a boat, and drift. These were operational questions about the concept.
- Considered instead
- Citizens deploying, monitoring, and recovering the buoy on their own.
- Decision
- Propose partner-led installation and maintenance, with citizens monitoring a deployed buoy from shore.
TradeoffBoat access and maintenance move to the partner; they remain requirements of the service. A geofence and drift alert are part of the proposed response to drift.
Still to testThe revised model assigns installation and maintenance to partners. Next, test a maintenance agreement with a potential partner. See the proposed roles and data journey →
App & service
A buoy you adopt, an app you check.
A tethered buoy listens to underwater noise near the coast and sends readings to the person who adopted it.
Solar panel
Self-powered, off-grid.
Hydrophone
Captures underwater noise.
Anchor + tether
Community-anchored, so it stays put.
Adoption, not subscription. People check on a thing they own; they scroll past a cause.


Reading the data
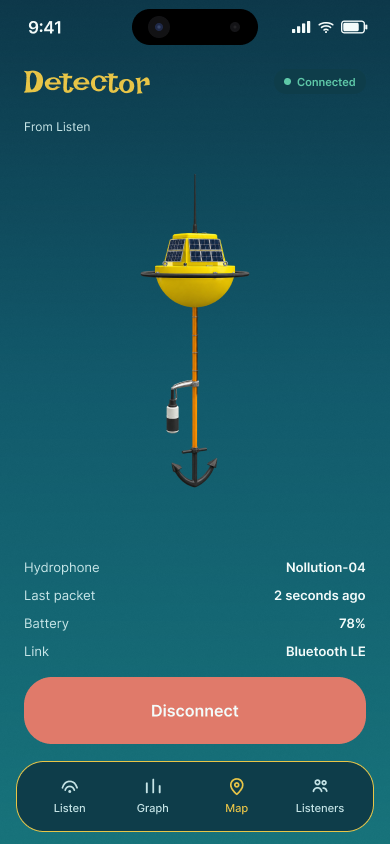
Is it connected? Is it current? What changed?
Device health stays beside the reading. “Last packet” shows when data last arrived, not just whether the device says it’s connected. The graph leads with a sentence like “Thu peaked at 156 dB, whale band ran loud for 3 hours.”
TradeoffThresholds, source classification, and remote connectivity still need validation.
How data moves · proposed service
- 01Deploy
Partners install and maintain the buoy
- 02Collect
The buoy records underwater sound; citizens contribute observations
- 03Dataset
Readings accumulate into a research dataset
- 04Interpret
Researchers validate readings and investigate noise sources
- 05Return
Findings reach the community and advocates
Proposed roles; no partners are signed on. The next checks are what researchers need from the dataset and who can sustain the maintenance.
What I learned
The hard part was never the screen.
Pressure-test the operations before the interface.
Every hard question in critique was about deployment, boat access, and drift. The physical and operational model needed testing before any screen polish.
The data already existed. My job was one plain sentence above the graph.
“Thu peaked at 156 dB, whale band ran loud for 3 hours” does more than the bars. Now I write the takeaway a non-expert should read before I pick the chart.
What’s next
What I couldn’t solve
- Saltwater maintenance
- Unreliable solar and offshore signal
- Permits for where a device can go
If I ran it again
- Test a maintenance agreement with a potential partner
- Check whether the dataset would be useful to researchers